NZGDB Newsletter #14, October 2008
In this newsletter:
-
Now
over 10M records in the GDB!
Producing
a Chart File for Printing
Printing
a Chart – using the GDBChart program
Help
us test this feature. What else would
you like it to do?
If our previous newsletter had little to
report, this month we’ve got two bits of really exciting news.
Now over 10M records in the GDB!
Firstly, we now have – fanfare please – over
10M records in the GDB. To be precise,
this morning (2nd October) we have 10,008,845. Amazing!
A year ago we were excited because we’d passed the 1M mark, and in the
last newsletter, only two months ago, we were announcing that “NZGDB was almost
at 7M records”.
10M means that NZGDB is truly a significant
resource. To find a larger genealogy database you will
have to go to the large U.S. based databases, but there you will find fewer
people with a New Zealand connection, you won't find scrapbook information, you
won't find duplicate links, and you won't find the ability to print out family
tree charts. So we’re very proud of our achievement. Especially when you remember that only 16
months ago NZGDB was launched with about 400,000 records in the database.
There has been a healthy growth in databases
directly submitted by users, but of course most of this data has been loaded by
Datamanager (Tony) from publicly available databases. Where we can locate the record owner we do so and transfer the
database to them, but unfortunately we have been unable to make contact with
many database owners. So if any of this
data is yours, please let us know and we’ll be only too happy to transfer
ownership of it over to you. We would
love to have NO Datamanager databases at all, an impossible dream unfortunately
as many people have posted databases on the web and then abandoned them, often
leaving an email address that bounces, sometimes leaving no contact details at
all.
One of the unfortunate consequences of being
unable to establish ownership and leaving the tree owned by Datamanager is
that, because we do not understand the data as well as one understands one’s
own database, it is easy to end up with duplicates. We try to avoid duplication, and have deleted several Datamanager
databases when we have found them to be essentially the same as other trees, but
it takes time to sort this out. So please
help us out by telling us when you find what appear to be duplicates, and we’ll
then do something about it. It helps no
one to have lots and lots of records of the same person, all giving the same
information. Especially if it’s
incorrect! We love having 10M records
in our database, but we’d rather have fewer records than fill the database with
lots of clutter.
We now do Charts!
The last newsletter said “There’s not a lot in
the Software Changes section this month.
There’s been lots of activity underneath the surface, but little to show
for it externally.” We can now reveal
the results of some of that activity.
The most exciting development is that NZGDB can
now produce printed genealogy charts.
NZGDB has been good at showing you individual records, but there is
nothing like a tree chart for seeing the relationship between people, and
giving you a sense of your place in the family. It has long bothered me that,
while you were able to see records and click your way around a tree, it was
very difficult to get a sense of the whole tree structure. This problem is now well on the way to
being solved, with the release for testing of our Charts feature.
If you can see a record, you can produce a tree
chart from it. It does not have to be
your own record, although of course the system’s privacy rules continue to be
enforced. Just as you can’t see living
or other private records without the permission of the record owner in the web
pages, they are not printed on charts or reports either.
Having an ability to print charts takes us a
big step towards one of our aims, of providing a complete system with the
features of a desktop genealogy database while having the advantages of a
shared database available on the web.
It’s like having your favorite PC genealogy program (Legacy, FTM, etc)
with a world database!
It also is a step towards another aim,
encouraging people to create combined trees where “I look after (own) this bit
and you look after that bit”. Charts (and reports) can include data from many
owners: print an hourglass report from
my favorite demonstration record - (OLD, Hannah(1860-1939)(robertb/barnes.ged)
– and you’ll see that the tree contains records from
Mirk Smith who has researched the OLD family, and
from my cousin Don Barnes. Without the
ability to print out a chart, it was very difficult to understand how trees
should be combined, and which records in your tree should be replaced by
records from the other’s tree.
Charts are produced by producing a file from
the database that is printed on your PC by a program that you download from the
web site. I’m
sorry Mac users, but this requires a Windows system. I couldn’t find a way of doing what had to be done in a web
program, so I had to write a program to execute on the client (i.e. your)
computer. With my skills and my
development software that meant that the client computer has to be one of the
current Windows family, such as Windows XP, or Vista.
Producing a Chart File for Printing
When you open a GDB record you may have noticed
a [Reports] button. This used to take
you to a page that was a printer-friendly version of the standard individual
page. On this page you had options to
print a couple of reports: outline
descendents, and basic pedigree report.
Now the [Reports] button takes you to a new
page designed to control the various reports and charts that you can produce.
At the top are the three previous reporting options, but the page also offers
three new chart options, Ancestors, Descendents, and Hourglass: -
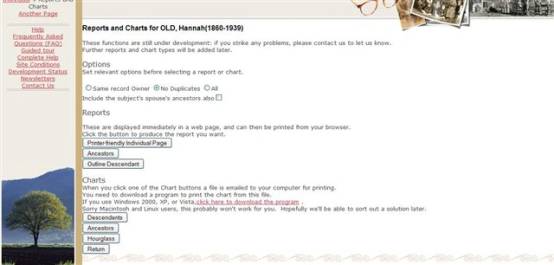
Charts work like this
·
You
click one of the buttons and a file is emailed to you. You can of course click each of the three
buttons if you want all three types of chart.
·
You
download the GDBChart program to print the chart(s) from these files.
Click one of the chart buttons and a message is
produced saying that the chart data has been emailed to you. Shortly thereafter it appears in your inbox,
with an attachment of type “.gdbc”.
In the example above I am producing charts of
Hannah OLD, my grandmother and my favorite demonstration record. You can print a chart or report from any
record that you are allowed to see; it does not have to be your own
record. Thus if you find that somebody
else has your family in their tree, you can print a chart from their tree to
see whether they have any people that you don’t have, or vice versa. Of course the standard privacy rules will
apply: in a printed chart, as on the web, you will not be able to see their
living people or other private records without their permission, just as they
won’t be able to see yours. The chart
will simply show “Male” or “Female” for the first generation of private
records, and will not descend the tree further to show lower generations.
Printing a Chart – using the
GDBChart program
Program GDBChart opens with a blank form: the
first thing you do is to open one of the files that you saved from the email
attachments. The form then displays
part of the chart. It usually won’t fit
on the form, especially at 100% scale, and you’ll have to scroll the form to
see the rest of it. In fact you might
see nothing at all at first, as it’s not uncommon for the top left corner to
contain nothing.
Click the Layout menu to display a form that
allows you to change the way the chart is displayed. Here we’ve changed the
chart to 50% scale, and set the printer to A4 Landscape: -
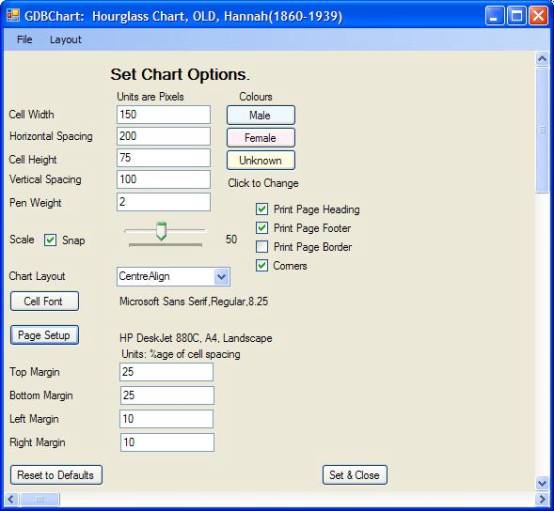
Note that Layout doesn’t allow you to change
the type of form, or its subject. I
chose an Hourglass chart of Hannah OLD when I downloaded the data. I’d need to
do another download if I wanted another type of chart, or another subject.
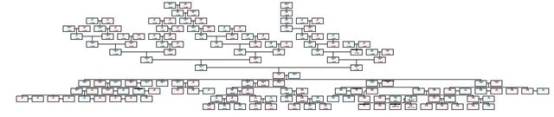
Here is this chart, scaled to 15% so that it
can all be displayed. Of course it is
not readable at this scale.
Here is a bit of detail from the middle of this
chart, at a readable scale. Those of you
who have attended one of my presentations will know that an enthusiasm of mine
is to persuade people to build combined trees. I would prefer that people link
to records of interest in other people’s trees rather than us each taking
copies of each other’s records, cluttering the database with duplicates and
carrying information that will become obsolete. Naturally I try to practice what I preach. Look at this example: -
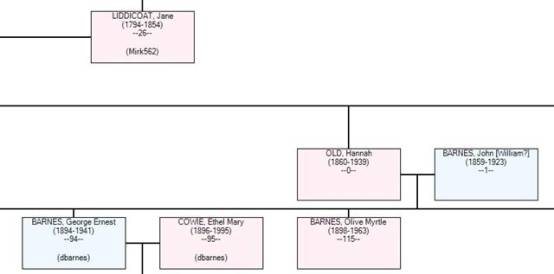
Hannah OLD and John [William?] BARNES are my
records, as is the record of Olive Myrtle BARNES. But George Ernest BARNES and Ethel Mary COWIE are records from
the tree of my cousin, Don BARNES.
After all, he ought to know more about his parents than I do. And the record above of Jane LIDDICOAT is
from Mirk Smith (user Mirk562) who we regard as the authority on the genealogy
of the OLD family. Because her
records were better than mine, I simply linked my Hannah OLD record to her
records of John OLD and Mary Jane KNUCKEY, Hannah OLD’s parents. You can’t see John OLD’s record on this
small section, it’s out to the left, but Jane LIDDICOAT is his mother.
Help us test this feature. What else would you like it to do?
As a brand new feature, we anticipate that
we’ll discover many errors and omissions as other users try it out. Tony and I have done some initial testing,
and we’ve now released it for user testing, but we don’t claim that it’s
finished. We’re aware of a few errors already, no doubt there remain more
situations that it doesn’t handle, and features that we’ve left out. So please give us feedback. What doesn’t work? What else would you like it to do?
Known errors:
In the test database my evil stepbrother, Robert Test BARNES, had an
affair with my wife producing a child.
This confused the chart program, and it ended up allocating my children,
as well as his own, to him. May he rot
in hell! Another error: in a very
large chart it inserted some unwanted space in the middle of the chart, although
it did produce the complete chart and everybody was linked correctly.
If you discover further situations where the
chart is incorrect (but the database is actually correct, it is just the chart
program that is wrong), I want to know.
Are there any more options that you want to
have in the chart program? On my list
so far: -
·
Ability
to search for a person
·
Ability
to display and print a partial chart.
For example, if I’ve downloaded the ancestors of Hannah OLD, then I
should be able to display part of this chart, such as the ancestors of Jane
LIDDICOAT.
Are there any more chart types that you would
like. My list so far contains: -
·
W
Charts (should we call these Whanau charts?).
Starting with a couple, get their descendents [for some number of
generations?], then chart the ancestors of all of these descendents. For example, a W chart starting with Mary
and I would get our three daughters and our seven grandchildren, then produce a
chart showing the ancestors of this whole extended family, including the
ancestors of our sons-in-law.
·
M
Charts. These are like W charts in reverse. Starting with an individual or couple, go up
the tree [for some number of generations?], then chart the descendents of all
these ancestors. This will really test our ability to handle very large charts.
·
Comparison
Descent charts. For example, print a
descendents chart of my Hannah OLD record and Tony’s Hannah OLD record,
highlighting the people that are in one tree and not the other, or where the
corresponding people have different names and dates
·
Comparison
Ancestry charts. As above, but for
ancestors.
·
Relationship
charts. Shows how xxx and yyy are
related. This will be a lower
priority, especially I don’t yet know how to do this except in the simple case
where there is a common ancestor.
So, let us know what you think. What else would you like? What are your priorities?
NZGDB Presentations
Since the last
newsletter I have given presentations in Wellington, St Heliers, and Warkworth. This month I have presentations or demonstrations at:-
·
Whangarei,
this weekend, 3-4th October, I will be demonstrating NZGDB at the
Family History Expo, which is at the Whangarei Library from 9AM to 1PM on
Saturday and Sunday.
·
Kumeu/Huapai. The meeting at St Chads Hall starts at 10:00AM
·
Paraparaumu. I’ll be presenting a workshop on NZGDB at
Find Your Family @ Coastlands, on Saturday 25th October.
As I said in
the last newsletter, I’m happy to make a presentation about NZGDB anywhere, any
time. Within the Auckland area (defined
loosely as “I can drive from Birkenhead, and don’t have to stay overnight”)
simply ring or email me, and we’ll see what can be arranged. Outside this area, if you are happy to help
with travel costs, then I’ll come and talk to you.
Regards,
Robert
Barnes,
NZGDB
Developer
Tony
Cairns,
NZGDB
Data Manager